/prod01/prodbucket01/media/durham-university/departments-/physics/teaching-labs/VT2A9034-1998X733.jpeg)
Report Structure
All scientific reports are broken down into sections that are listed and described below. Most reports will usually also have appendices which support the main sections. For Discovery Skills and Laboratory Skills & Electronics, these include an Error Appendix, Summary for a General Audience, and a Generative AI Statement.
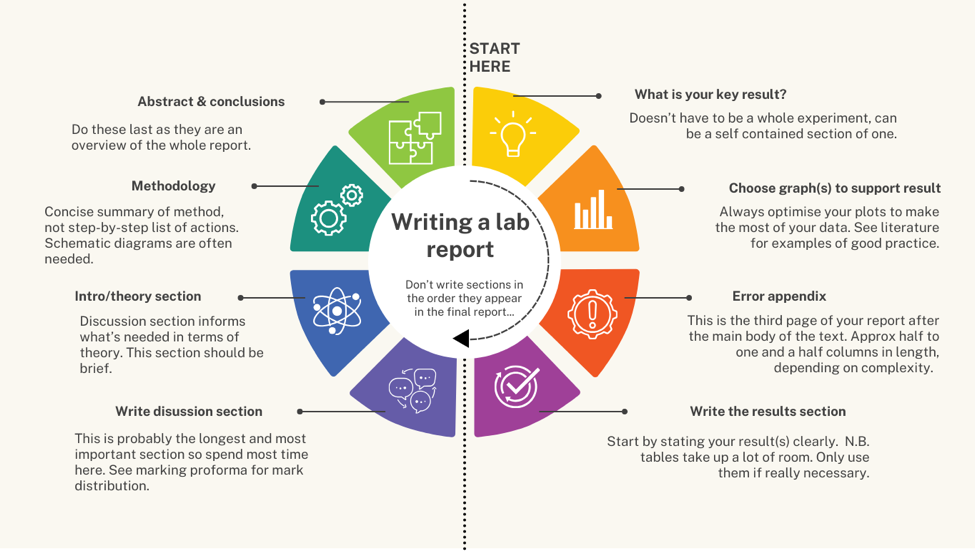
You generally shouldn't write the sections in the order they appear in the report. For instance, as you write the Discussion section, note any theory or relevant equations used to obtain the final result, then add those to the Introduction/Theory section. The diagram below shows one way to approach writing the report:
Abstract
The abstract comes first and is a short paragraph giving a summary (an abstraction!) to the reader of the major methods and results presented in the report. An abstract should:
- Make sense on its own. Don't refer to tables, equations, etc. that appear in the report. If you reference anything it will need the full bibliographical reference.
- Contain the key results, as numbers if possible (quantitative rather than qualitative). If a numerical result is stated and the expected value is known, compare the two.
- Include some statement about the physical conclusion drawn from the experiment.
- Be short and concise (200 words or less for Discovery Skills).
Introduction
The aim of the introduction is to place your report into a broader context. It should discuss:
- The background of the topic, related work by other scientists, and any potential application.
- Relevant theory and equations.
- The motivation and objective of the report.
When quoting known constants, use reputable references such as the original experiment it was determined or NIST, National Institute of Standards and Technology (nist.gov)
Keep in mind the audience you are writing for, which is usually your peers! If a physics student at your level of study would reasonably be expected to know something, it doesn’t need to be explained in detail or supported with a reference. You should concentrate on explaining (with appropriate references) physics that is ‘new’ to you.
Method
The method is a concise summary describing your setup and methodology. Usually, you will describe the apparatus first, which is often best done with the help of a labelled diagram or schematic.
You should be writing your methodology so that a reader who is familiar with the apparatus used (e.g. another competent scientist) understands how to reproduce your measurements. Describe the capabilities and limitations of the equipment as well as what actions were carried out. You can also mention the method used to analyse your data or how you estimated your experimental errors (though most of this should go into the Error Appendix).
- Avoid going into unnecessary detail (e.g. the weather that day, exactly which student carried out which part, colour of the apparatus) or providing a list of the individual steps you took. Instead, you could explain the logic behind what you’re trying to do and how you achieved it.
- Do not use diagrams from the laboratory script; draw your own if required. These can be drawn in PowerPoint/Publisher/Other Graphical Software and exported as a picture.
- Use the past tense, as you’ve already carried out the experiment.
- In conjunction, the method section and data presented should represent a reproducible description of the experiment.
Results
This section is where you give your results. It should contain a brief description of any calculations needed to get from the raw data to the final results, but any theory should be talked about in the Introduction or Method sections.
Consider how to get your information across in a clear and concise manner - such as with a graph, a couple of numbers, or a few lines of text. Any number that you produce needs to have its associated error. Remember: do not quote your results to more significant figures than allowed by their errors. For more on errors see ‘errors page’.
- Your results should be presented in a table or a figure which needs to be directly referred to and discussed in the text (e.g. "These results are summarised in Table 1"). This section should not be exclusively graphs/tables; include text that describes the results. For more on figures see Figures, Tables and Graphs.
- There should be no analysis of the data in this section, only reporting of the results.
- Include units when quoting results.
- Be quantitative (e.g. quote the exact number of standard errors away from the known value rather than just saying it’s in agreement or not).
Discussion
The discussion is the most important section where you analyse the physical meaning of your results and critically evaluate them. Some things to discuss include:
- Agreement with accepted/known values, where they exist.
- Examine and compare your method to other scientists. Relate your chosen method to the results and the errors.
- Discuss the sources of error and how to improve them – e.g. experimental methods vs. analytical methods (fitting techniques).
- NB: Simply saying “human error” is incorrect. Be more specific and explain the source of the errors;
- Discuss any errors you may have omitted and how this would affect your results.
- The implications of your results.
Tip: Try regularly referring to how possible changes would quantitatively impact your results (would it make them more precise? More accurate? By how much?)
While this section allows for a little more freedom than the others, it is important that it stays rooted in logic and evidence. If you make a statement, you should back it up with some evidence. Any physics used to interpret the data should be introduced in the Introduction section.
Having a structure and a sense of direction within your discussion is also important. It's better to talk in depth about a couple of big problems or implications that you've isolated than to list off several wild theories.
Conclusion
The conclusion should provide a brief summary of your work, primarily the main results and their implications. Generally, you will want to avoid introducing new concepts in this section and instead discuss how your results link back to the motivations given in the introduction.
This is the one chance to become a bit more subjective (but not too much!) in discussion of possibilities of future work (only if there is space).
Acknowledgements
A short section acknowledging any contributions made by others, financial or academic, towards the paper. You probably won't need to use this section until later in the course (Level 3 projects or later).
References
This is the list of sources cited in the rest of the report with full bibliographical information:
- Do not include anything that hasn’t been directly cited in your work.
- List and number them in the order they appear in the report.
- For more on referencing and examples of what they may look like, see Referencing.
Appendices and Statements
You are expected to include an error appendix at the end of your report detailing how your errors have been propagated. At Durham, you are also expected to include a general audience summary and a statement detailing any use of generative AI. More information about report appendices can be found at Appendices and Statements.