/prod01/prodbucket01/media/durham-university/departments-/physics/teaching-labs/VT2A9034-1998X733.jpeg)
Basic Data Analysis
INTRODUCTION:
Data analysis is a crucial skill that all physicists must master as it allows for suitable conclusions to be drawn from investigations. In many undergraduate experiments, you will be attempting to verify known and well-agreed upon values.
In a standard experiment, where all data points are subject to the same random error, this is done using the mean and standard error.
THE MEAN:
As a physicist, you will often find it necessary to repeat measurements multiple times and to take an average of the result. The most important method for calculating an average is by calculating the mean of the data, as you'll have come across many times in school.
For a set of N measurements of the value x, the arithmetic mean of x is defined as:
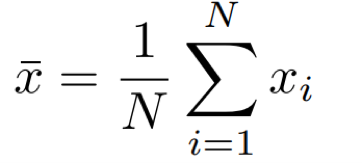
Eq. 1: Equation for the mean.
In words, the mean is calculated by dividing the sum of the points by the number of points.
THE STANDARD ERROR:
The standard deviation measures the spread of data values within a single dataset and given by:
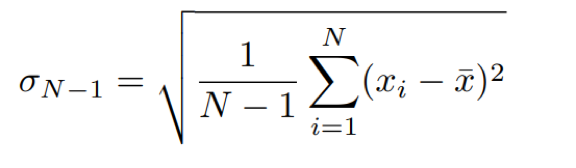
Eq. 2: Equation for standard deviation.
If we were to take the error of the mean to be the standard deviation, it would be very pessimistic! More importantly, if we were to repeat the measurement more times, there would essentially no change to the standard deviation. However, we would expect the random error in the mean to reduce significantly. So how do we take this into account?
The standard error is the standard deviation of the mean across repeated datasets of a population and tells us how accurately the sample represents the whole population. Be careful as the standard deviation and the standard error are easily confused!
For a set of N data points, the random error can be estimated using the standard error approach, defined by the equation:
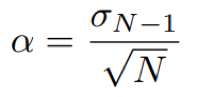
Eq. 3: Equation for the standard error.
where σN-1 is the standard deviation as previously defined.
See examples of how to calculate these for a sample data set in Excel below.
QUOTING YOUR RESULTS:
Using the correct number of significant figures is crucial in showing the precision of your data and something you will be constantly reminded to check! Results should be quoted to the number of significant figures such that the last digit is the same order of magnitude as the uncertainty. For example, a reading of 0.245 V with an uncertainty of ±0.01 V should be quoted as 0.25±0.01 V.
The rules for significant figures are as follows:
- All nonzero digits are significant: 1.234 g has 4 significant figures.
- Zeroes between nonzero digits are significant: 1002 kg has 4 significant figures.
- Zeroes to the left of the first nonzero digits are not significant; such zeroes merely indicate the position of the decimal point: 0.001 oC has only 1 significant figure.
- Zeroes which follow a number after the decimal point are significant: 0.200 g has 3 significant figures.
- When a number ends in zeroes that are not to the right of a decimal point, the zeroes may not be significant: 50600 calories may be 3, 4, or 5 significant figures.